25%
25%Revenue
7.9%Operating EBITDA
PAT
9.0%Cement production
Capacity utilisation
9.2%Cement and GGBS sales
Thermal substitution rate
Harvested rainwater consumed
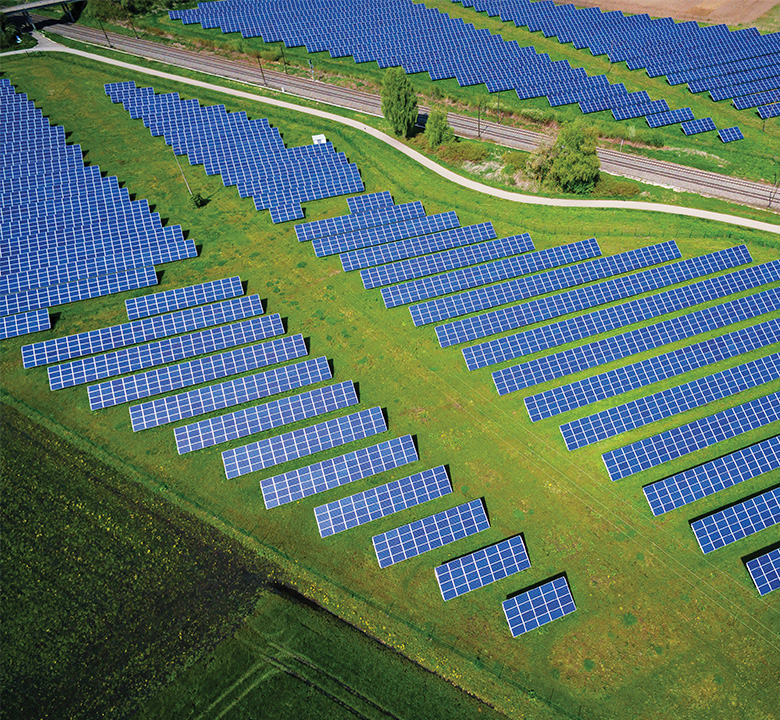
Solar power plants utilised
at Nandyal and Salboni in
FY 2022-23
Of water consumption per
T of cementitious material
Employees were covered under regular performance and career development review
Increase in diversity
CO2 emission intensity
y-o-y
With 'CO-CREATE', we present our sustainability strategy for the first time. Our strategy encompasses 7 strategic pillars that have been identified through our Group’s core focus areas, our materiality assessment and sector material issues.
View Targets
Dear Stakeholders,
We have now embarked on a phase of aggressive growth to emerge among the top five cement companies by 2030, while maintaining our lead in sustainability.
NIRMAL KUMAR JAINCHAIRMAN
Read more
Dear Stakeholders,
We want to gain 10% of the market share and become the 5th largest player by 2030. Our capacity expansion is geared to achieve this goal.
PARTH JINDALMANAGING DIRECTOR
Read more
Dear Stakeholders,
We are already acknowledged as the World's #1 eco-friendly cement company, and our low-carbon products are setting new benchmarks in sustainable construction in India and across the globe.
NILESH NARWEKARCEO
Read more
Financial Capital
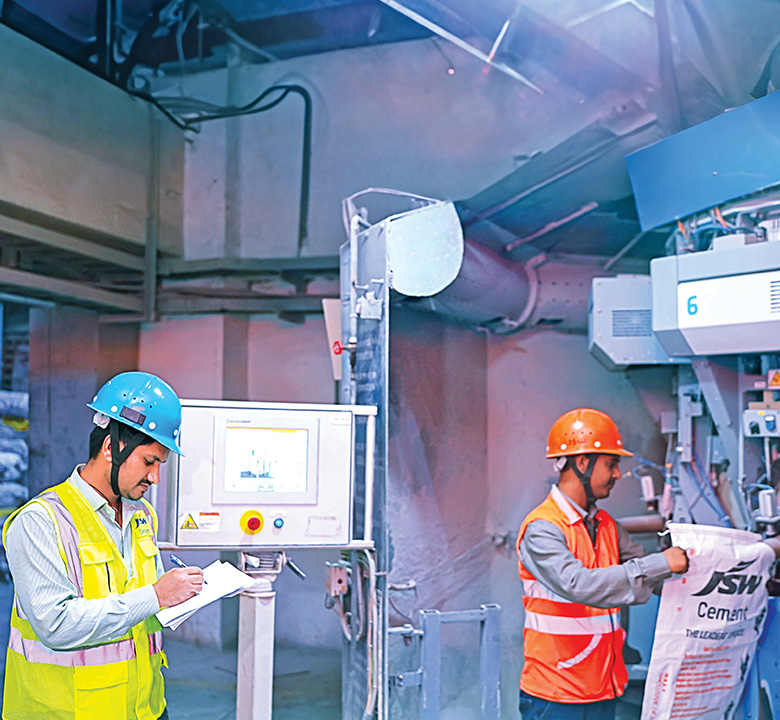
Manufactured Capital
Human Capital
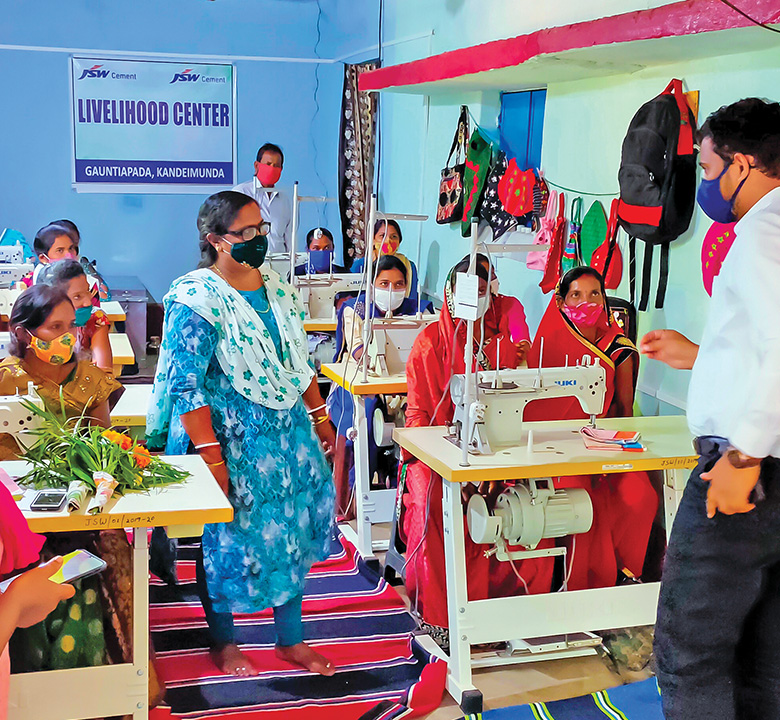
Social and Relationship Capital
Natural Capital
Equity
` 986 crore
Debt
` 5,422 crore*
Fixed assets
` 4,408 crore**
Net worth
` 2,195 crore
*including CCPS of ₹1,610 crore issued to Investors
** including ROU & intangible assets
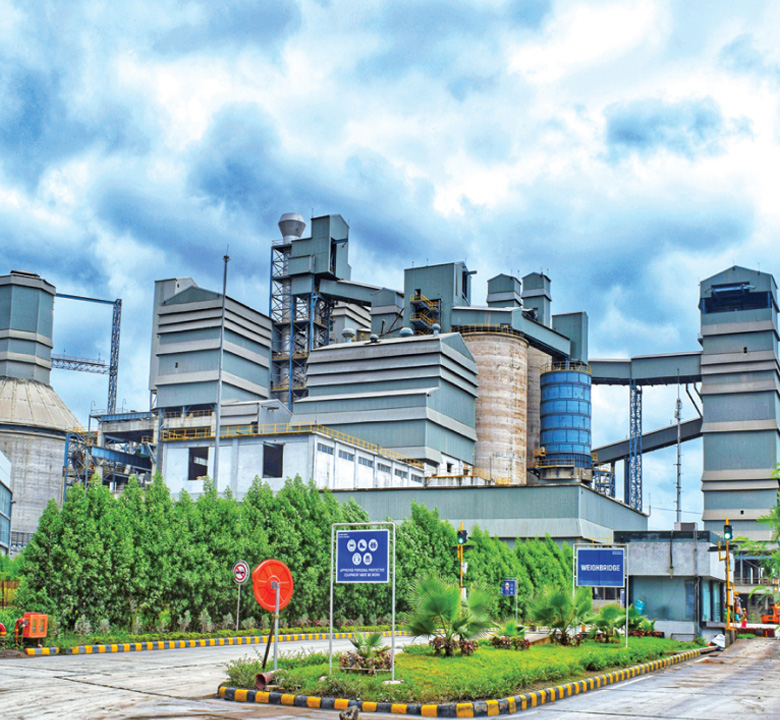
Plant-wise capacity
Nandyal integrated unit
4.2 MTPA
Vijayanagar grinding unit
4.0 MTPA
Salboni grinding unit
3.6 MTPA
Dolvi grinding unit
2.5 MTPA
Jajpur grinding unit
1.5 MTPA
Salem grinding unit
0.8 MTPA
Total manufacturing capacity
16.6 MTPA
Employees on roll
1,445
Contractual employees
2,134
Employee benefit expenditure
` 295 crore
Total CSR expenditure
` 7.01 crore
Dealer network
4,000+
Sub-dealer network
7,800+
Total fuel used (excluding BF & CO gas)
284,996 tonnes
Total BF and CO used
5 crore nm3
Total water used
685,938 litres
Total electrical energy consumed
405.6 Mn units
RE consumption
16 Mn Units


Financial capital
Manufactured capital
Human capital
Social and Relationship Capital
Natural capital
Revenue
` 5,837 crore
Operating EBITDA
` 817 crore*
PAT
` 59 crore
ROCE
7.37%
Debt equity ratio
2.47
EPS
` 0.93
*Operating EBITDA
Capacity utilisation
57.50%
Increase in cement and GGBS production
9.0%
Lost Time Injury Frequency Rate (LTIFR)
0.23
Employee retention
81%-Male
88%-Female
Gender diversity
5.4%
Graduate Rotation Program (GET) - Female
15
New joinees
393
Beneficiaries impacted
222,549
Wastewater recycled
53,434.2 m3
Share of harvested water in total water consumption
25%
Waste utilised
7.3 MnT
CO2 Emissions avoided
45,702T
Thermal substitution rate
8.14%
CO2 Emission
173kg/T
Activities
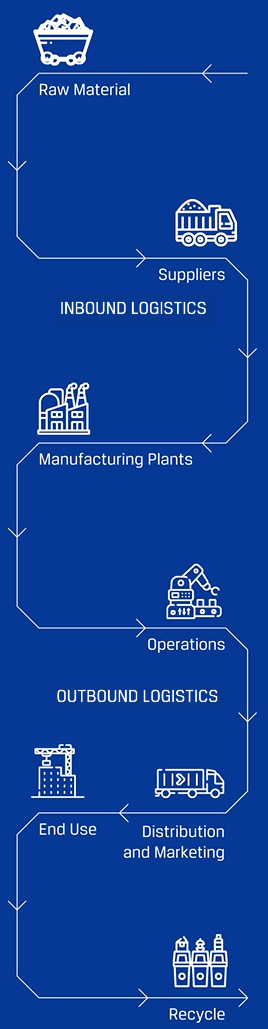
Output
We have made significant strides in the past year across our major strategic pillars, capitalising on existing and emerging opportunities within the industry. Our strategic priorities have allowed us to address stakeholder concerns and meet their expectations.
Read more
FY 2022-23 Highlights
Profit After Tax (PAT)
Net fixed asset
Earnings Per Share (EPS)
Book value per share
FY 2022-23 Highlights
Cement capacity utilisation
Cement/ GGBS production
Investment in WHRS at Nandyal
Tie-up with JSW Energy for solar power at Vijayanagar
FY 2022-23 Highlights
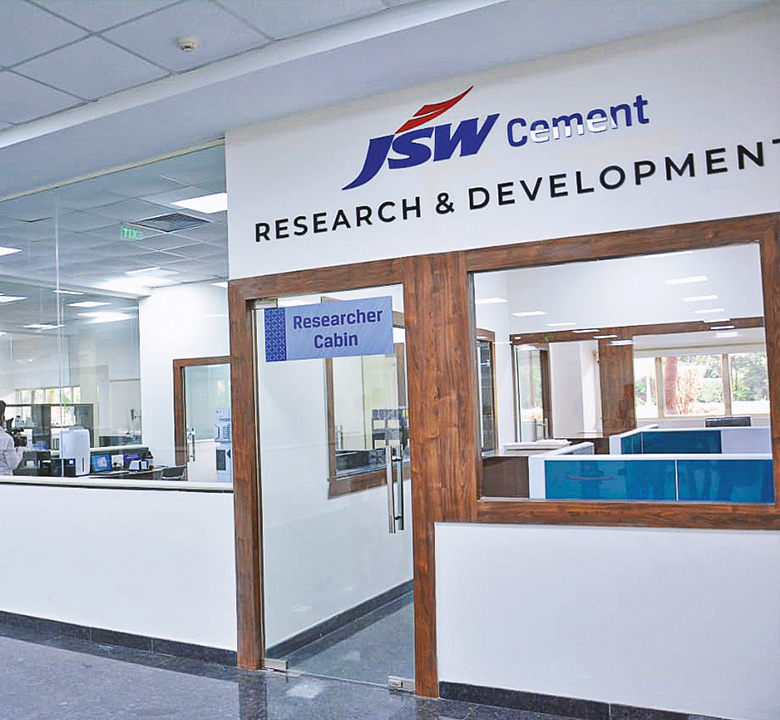
Digital projects completed
Visits on Saathi platform within two weeks of launch
Of limestone saved due to 2% decrease in clinker factor in FY 2022-23
Sites covered through 55 cement care vans and four stationary labs for technical workshops
FY 2022-23 Highlights
Thermal substitution rate
Waste derived resources used
Of cementitious material net CO2 emissions intensity (Scope+Scope 2)
Water consumption per tonne of cementitious material
FY 2022-23 Highlights
Increase in diversity
in FY 2022-23 (y-o-y)
Of trainees who joined the programme in FY 2022-23 successfully completed their journey
Training hours per employee
Total safety training hours
FY 2022-23 Highlights
Women trained in FY 2022-23
Villagers get access to purified water
Villagers benefitted through government schemes
Treated for non-communicable diseases
We have instituted best-in-class governance practices, policies, and structures to guarantee our commitment to conducting our business ethically and responsibly.
Read moreBacked by a solid expansion drive and continued focus on innovation in sustainability and technology during the year, the Company saw a 16.4% increase in revenue on a y-o-y basis.
Read more